

Brewing Shift in the Shape of Global Growth
Brewing Shift in the Shape of Global Growth

Tech -> Overextended
By Chris Watling, Global Economist & Chief Market Strategist
Timing rotation into new global sector leadership is, and always has been, challenging. Indeed, over the past 9 months (since the October low), the rotation has been stop-start (with Nvidia and other mega cap tech stocks retaining overall market leadership). Historically the switch has often occurred after recessions. Yet, at this juncture, the consensus, expects a soft landing in the US (and not a recession, which we agree with) - perhaps the pandemic has made it 'different this time' (or perhaps not1). Other non tech/old economy sectors in key parts of the global market, though, have started to perform well. As at the end of May, Italy, Spain (both key OWs in our global AA portfolio) and EZ financials had all outperformed the NDX100 (and SPX) – fig 1.
Fig 1: YTD performance - various key global assets (up to end of May, %)
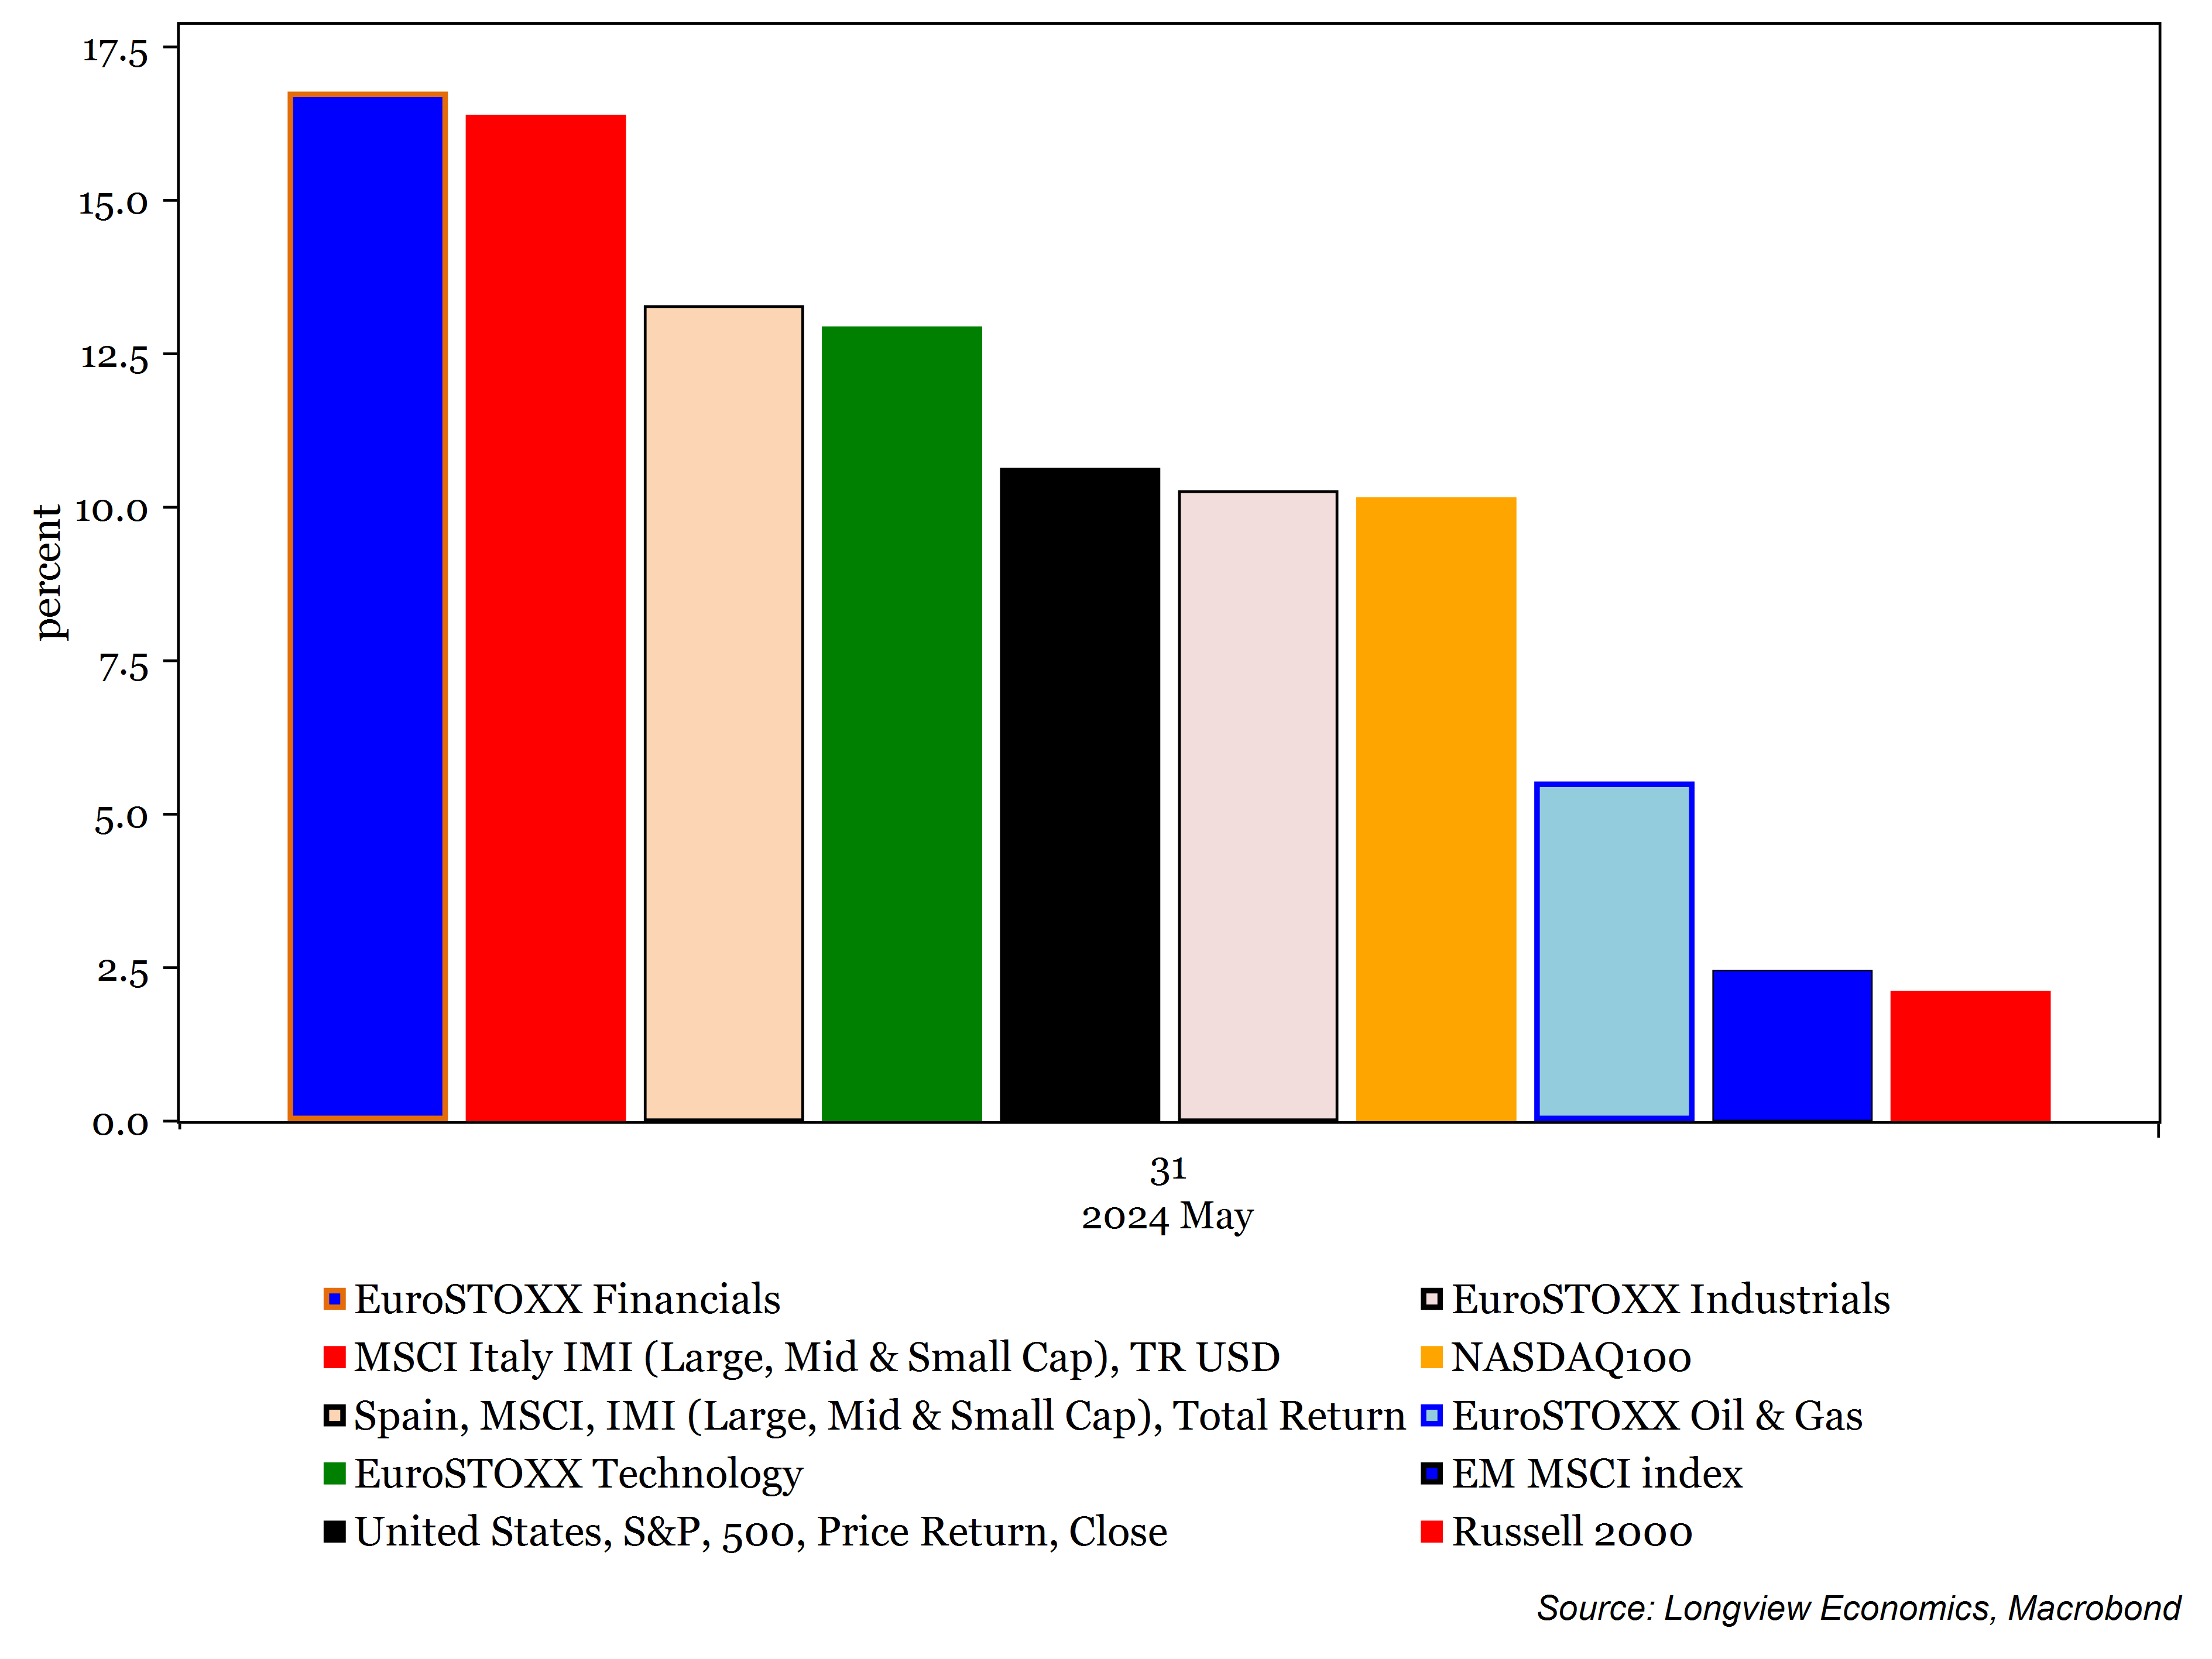
This week, though, there was a reversal of that trend. On the back of poor European election results for the centrists in Europe, and the calling of a snap French election, EZ equities have had a tough week. Key Eurozone country markets are down notably this week (and since their recent highs in mid-May). France’s CAC40, for example, is 3.7% lower (as of yesterday’s close); Italian and Spanish equity markets are both off ~3% so far this week (up to Thursday); while the DAX is 1.6% lower. Driving that weakness, there has been a widening of various Eurozone member state government bond yields over German bunds (i.e. a rising risk premium). French 10-year government bond yields, for example, have widened out to 68bps (from 49bps last week); Italian spreads have widened to 146bps.
That, therefore, raises the question: Is it time to abandon the OW Southern European equities trade? Or, should we assume that the ECB stands ready to backstop these spreads (in which case weakness in Europe is a BUYing opportunity). The backstop facility is, of course, already in place at the ECB. In July 2022, the central bank introduced its latest version: “The Transmission Protection Instrument” which is designed to “support the effective transmission of monetary policy”; and “can be activated to counter unwarranted, disorderly market dynamics that pose a serious threat to the transmission of monetary policy across the euro area”. In other words, the ECB can use it to counter widening of spreads.
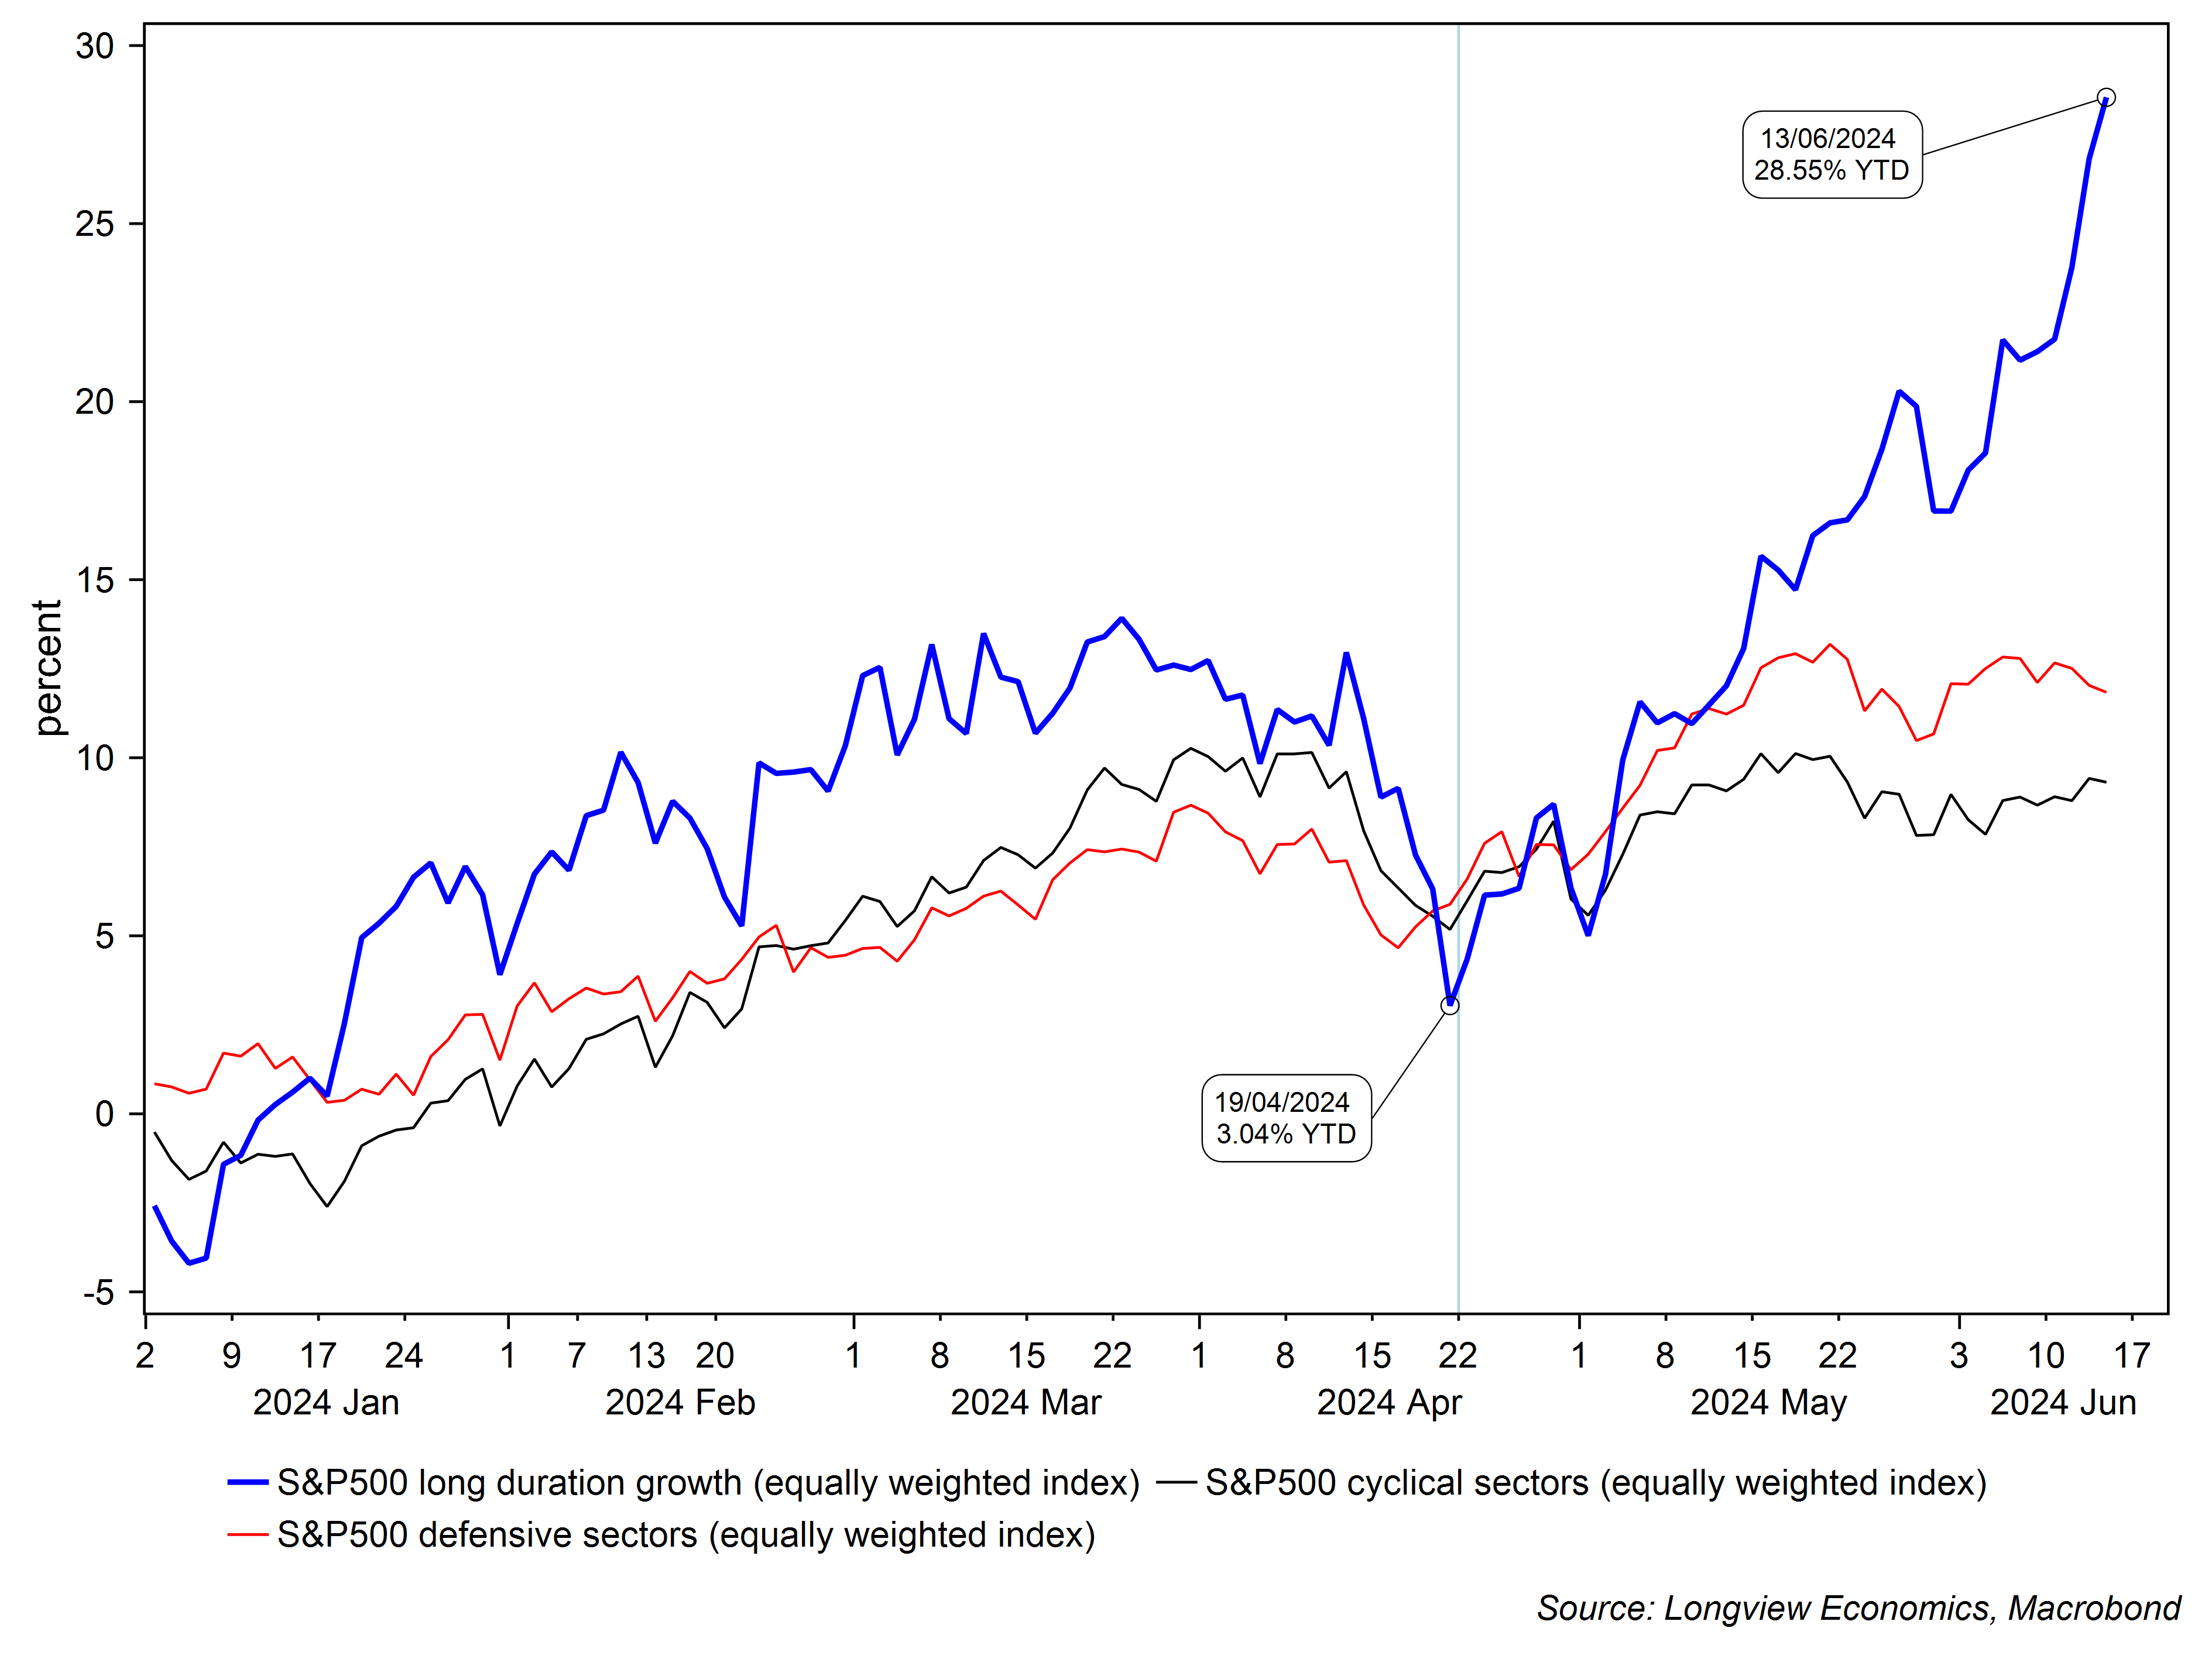
Elsewhere, in the US, tech has remained dominant - as it has been since late April (fig 2). That is, at the local April low (on 19th), the long duration growth sectors in the S&P500 were +3.0% YTD and (just) underperforming the cyclical and defensive areas of the market. In the past 8 weeks, ‘long duration’ growth has rallied a further 25% (now up 28% YTD), while the other areas of the market are 4pp & 6pp higher (cyclicals and defensives).
Fig 2: Key sectors/areas2 of the S&P500 (YTD performance)
As a result of that significant outperformance, those growth areas of the market are now notably overbought on a variety of metrics. As outlined in this morning’s Daily Risk Appetite Gauge3 publication:
“The tech area of the US market, is now notably overbought. Long duration growth, for example, is overbought in the short and medium term; the NDX100 technical model is on SELL and its 10-day moving average relative to its 50 day is stretched at +1 standard deviation (& on SELL).”
Source: Longview Daily Risk Appetite Gauge publication, 14th June 2024
Added to that, Nvidia is once again overextended to the upside (relative to its own 50 day moving average – fig 3). On the last 3 occasions it’s been this overextended, the share price has either stalled for a prolonged period (mid-2023) or sold off sharply (late 2021 and March this year).
All of which highlights the (near term) vulnerability of the current sector leadership of the US equity market.
Fig 3: Nvidia ‘over-extendedness’ indicator (price relative to its 50-day moving average)
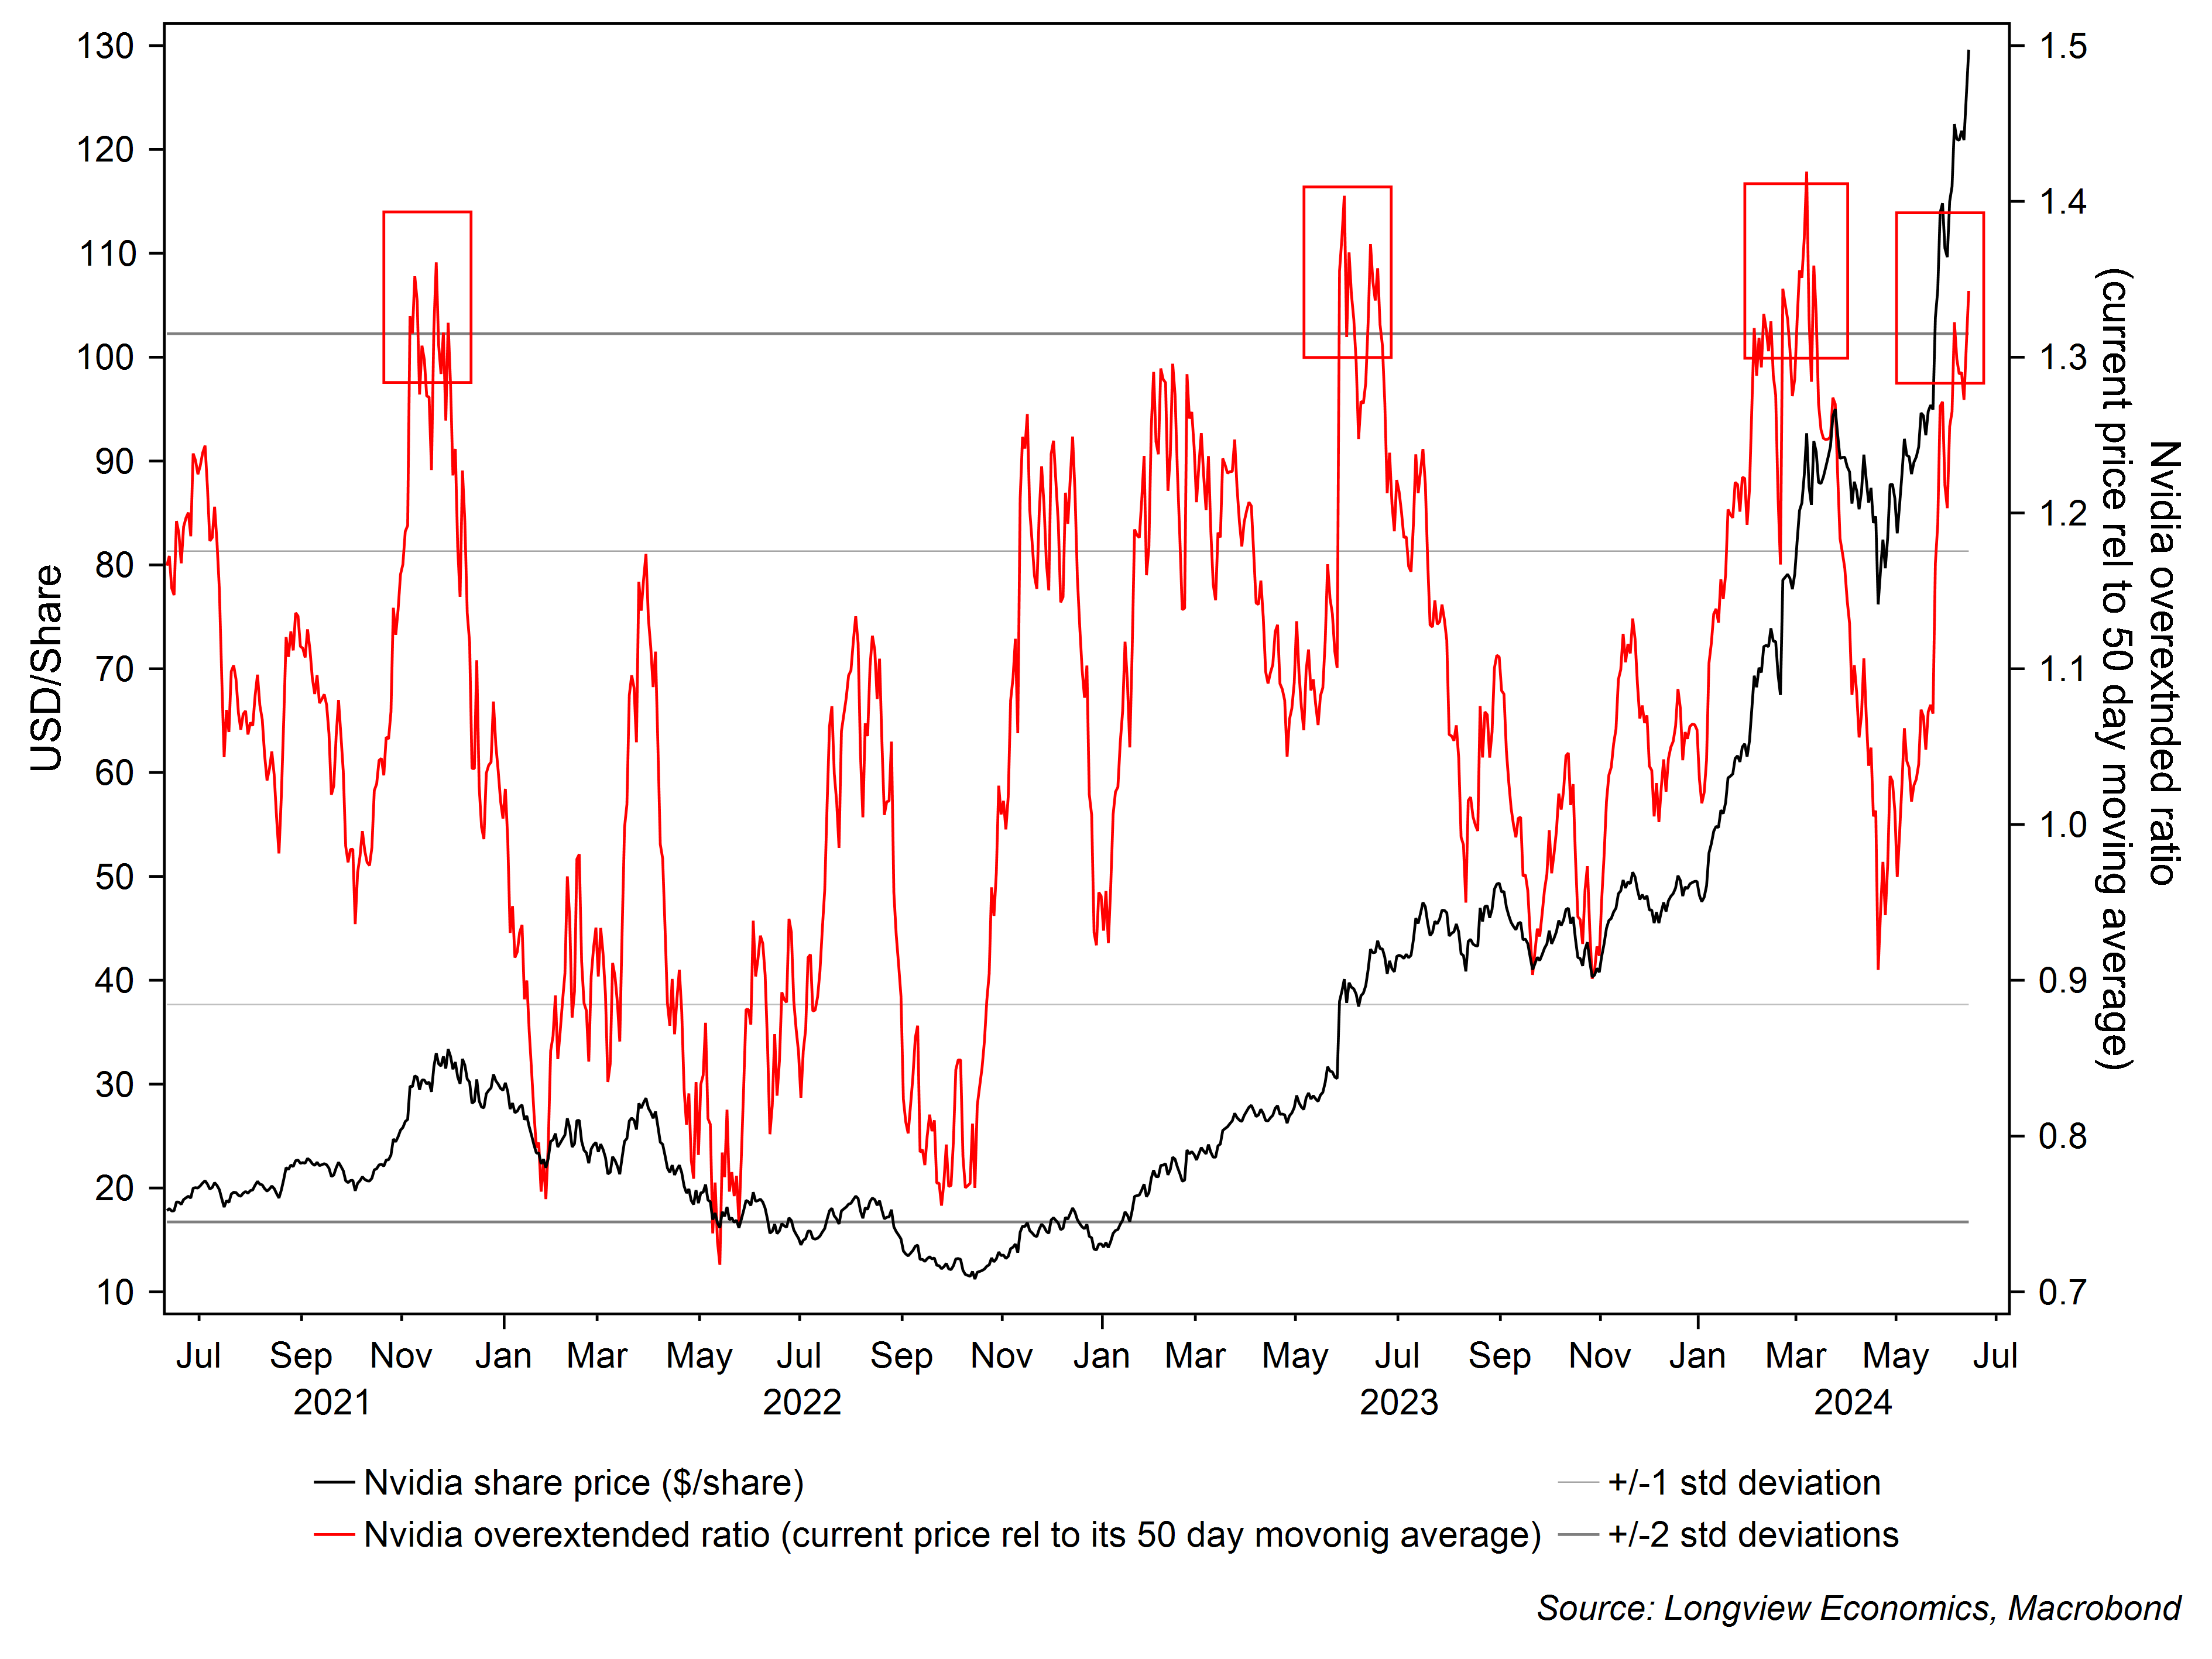
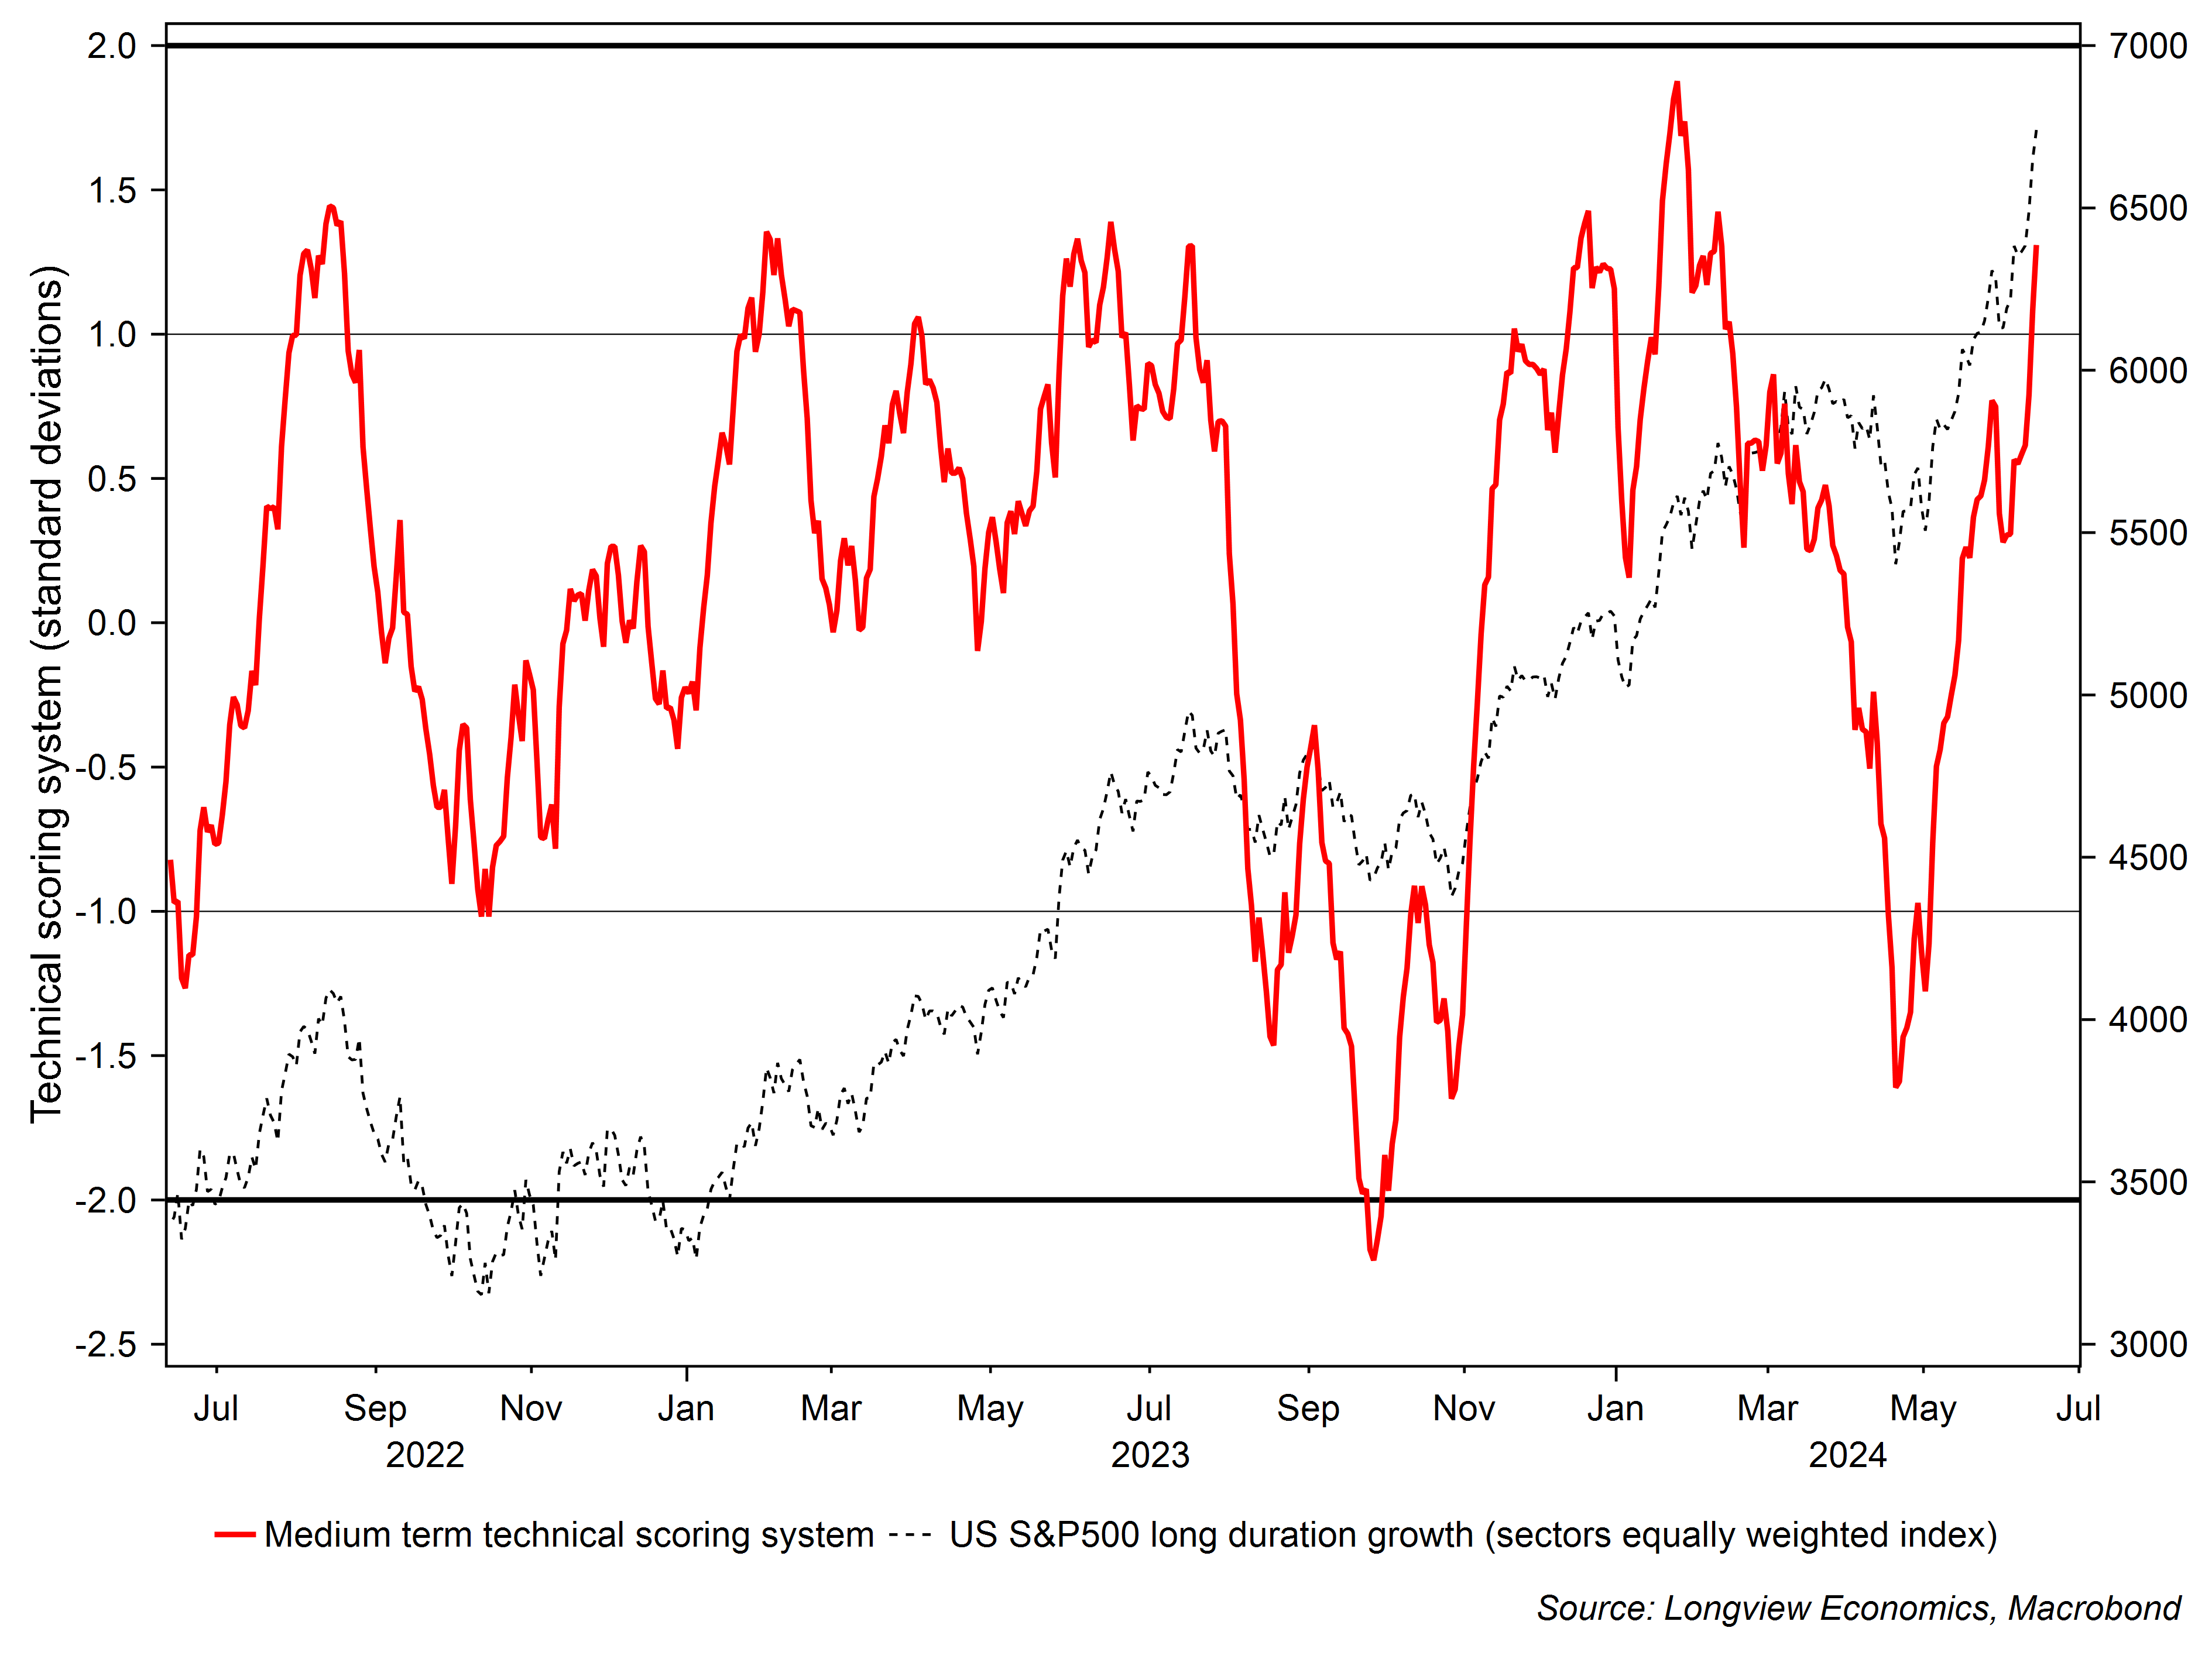
Fig 4: Longview medium term technical scoring system for S&P500 ‘long duration growth’ sectors vs. ‘long duration growth’ sectors index
Tactically, though, we remain overweight US equities (relative to bonds and cash) – contact nick@longvieweconomics.com for a copy of our latest publication. The overbought nature of the leadership laid out above, coupled with the challenges in Europe, generates some cause for concern about that overweight position (especially with the Fed pushing back this week on the extent of 2024 rate cuts, thereby making it harder, at the margin, for cyclicals to take up leadership of the market).
Having said that, according to our models there are no signs of euphoria in global equity markets, which is typically the case ahead of major pullbacks (i.e. and generated during the ‘blow off top’ phase).
Balance Sheet Drivers Of The Economy Are Changing
The switch in global sector leadership, though, will be driven by a switch in (economic sector) ‘balance sheet’ leadership (and a change in the shape of global economic growth).
That is, for the past 1 – 3 decades, true wealth creation has been limited across most Western economies (as shown by a lack of total factor productivity (TFP) growth). Policy makers, rather than allowing the (economic) system to clear (clean up), have applied significant amounts of policy support. That, in turn, has reduced the economic downside (pain), but comes with a price. That price has been an undermining of capitalism (many companies no longer allowed to fail); the growth of the zombie corporate base; high levels of money creation (whether by commercial banks in the noughties; or by central banks – and, by proxy, governments – in the past 15 years); and with that, rising income and wealth inequality and growing divisiveness in politics.
In an environment of limited Western wealth creation, therefore, leveraging up balance sheets has become the main growth driver.
In the late 90s and noughties, that meant leveraging up the household balance sheet and creating a housing and consumption boom (in US, UK and Southern Europe – e.g. see fig 6). Post GFC in the 2010s, that meant leveraging up the central bank and government balance sheets – whilst the economies in the West deleveraged their household balance sheets. Added to which, the global economy was also helped post GFC by a major leveraging up of China’s private sector (& central bank) balance sheet.
Now, though, Western (specifically US, UK and Southern European) households have deleveraged and their banking sectors have derisked, re-capitalised and shrunk (e.g. see fig 5). As such, these sectors are ready to grow again once rates are cut. At the same time, China has entered into a balance sheet recession which, like the Japanese version in the 90s and 2000s, is likely to last for an extended period.
In that sense, therefore, the balance sheet drivers of the global economy are about to change once again (as explained in our latest webinar – see link to recording at front of email).
Keep reading with a 7-day free trial
Subscribe to The (Long)View From London to keep reading this post and get 7 days of free access to the full post archives.