

Is a Currency Crisis (& Secular Dollar Bear Market) Brewing?
Is a Currency Crisis (& Secular Dollar Bear Market) Brewing?

Currency Vol has Died a Death in 2024 (so far)
By Chris Watling, Global Economist & Chief Market Strategist
It’s been all quiet on the currency front in 2024.
Despite the pricing out of a significant number of US rate cuts (i.e. re-introducing more yield support for the currency), the dollar hasn’t made much headway this year, as most of the major currency pairs are largely unchanged.
The GB£, for example, has traded in a narrow 4.6% range of 1.23 to 1.29, and closed on Wednesday down 0.3% YTD. The Euro, has been in a similarly narrow range (i.e. 1.06 to 1.11 (4.5%), and is currently 2.6% lower this year, while the CHF has traded in a wider 9% range (currently 5% lower YTD). The JPY is one of the poorer performing major currencies in 2024 (down 12% YTD), the RMB has remained above the key 7.30 level (down 2.1% YTD), while the AUD is 2% weaker year to date and the CAD is down 4.5% in 2024.
Fig 1: Implied currency volatility (various currency pairs1)
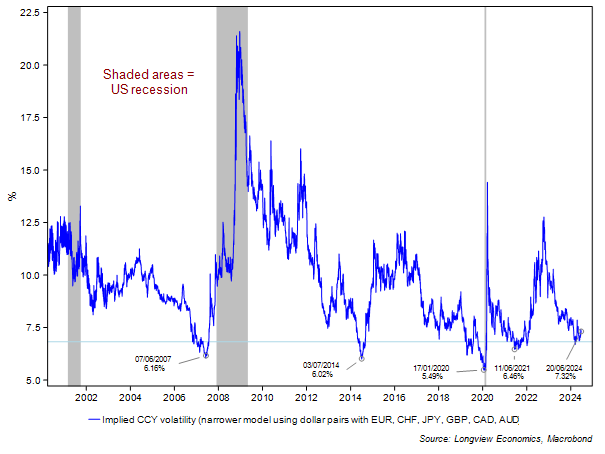
Like in equities, therefore, currency volatility has died a death in 2024. As fig 1 shows, the average volatility of various major currency pairs (all against the dollar) has fallen to one of its lowest levels on record (although still not as low as January 2020, June 2021, July 2014 and June 2007). On all of those occasions currency volatility made a major record low and then, within a handful of months, a major volatility event happened in financial markets. June 2007, of course, was followed by the global financial crisis; July 2014 saw significant equity volatility in the second half of the year (and then the Chinese currency crisis in 2015 – although that was a year later); January 2020 was just ahead of the pandemic (so arguably exogenous, albeit various models at that time were highlighting the risk of a volatility event); while June 2021’s currency volatility low was followed at the end of the year by the start of a cyclical equity bear market. Low volatility encourages more leverage and therefore creates its own environment for a volatility event.
Sentiment and Positioning –> Also Increasingly One-Way
In addition to low volatility, net speculative positioning has become extreme. In particular, positioning using underlying currency pairs (like USDGBP, USDEUR, USDCHF etc) is at its highest since 2015 – and one of its highest on record – fig 2.
Fig 2: USD net speculative positioning2 vs. US dollar futures
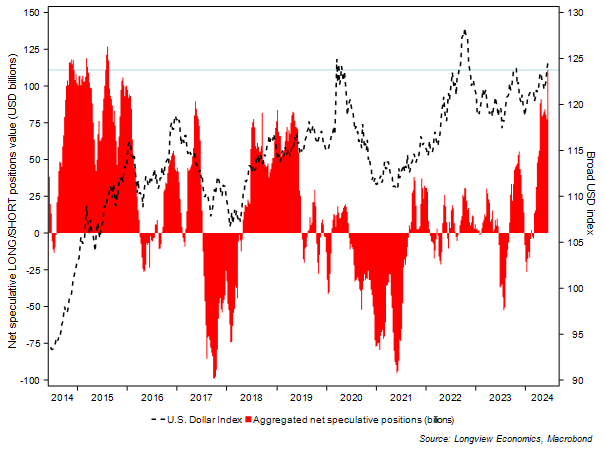
Underlying that aggregate positioning, the net speculative LONGs of the USD vs. the Canadian dollar are at their most extreme on record (i.e. market is notably SHORT CAD). Despite that aggressive SHORT position, though, the currency has held its key 0.72/0.73 support level on several occasions since 2016 (past 8 years). The market is also notably SHORT the Japanese YEN (although that currency has been weak this year); & against the Swiss Franc (with net SHORT size only surpassed in the past decade in 2018 & 2019).
Sentiment is bearish towards the non-dollar currencies (especially the CHF, JPY & CAD) and +1 standard deviation bullish the dollar index.
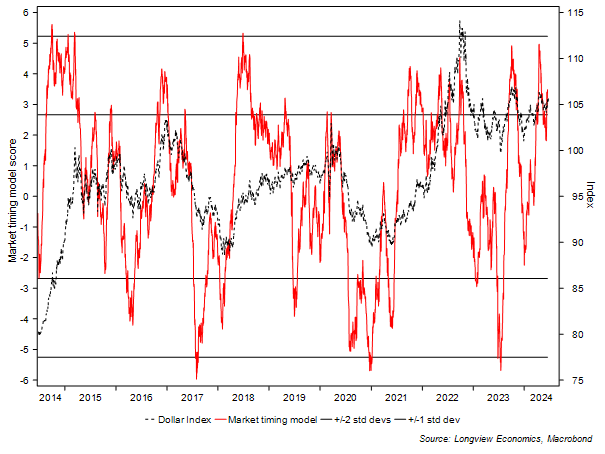
The ‘dollar market timing’ model (fig 3), which aggregates those factors along with our technical scoring system, is therefore on SELL (at its +1 standard deviation level). On many occasions, those SELL signals have been efficacious & timely. In a handful of instances, though, they have been early (or wrong).
Fig 3: USD futures market timing model vs. USD futures
Secular Dollar Bear Market Brewing
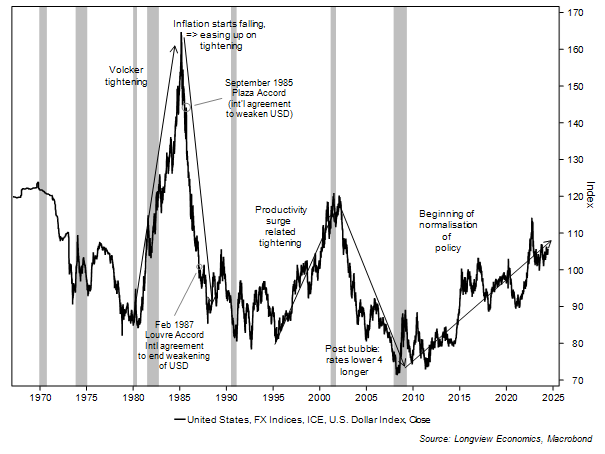
Since the end of Bretton Woods (1971) and the start of this enduring phase of freely floating currencies, there have been 7 prolonged phases of dollar strength or weakness (fig 4). In the 1970s, the dollar was in a sustained bear market, reflecting loose monetary policy, a lack of control of the money supply (high money growth) and high inflation as a result. Then Volcker tightened up real rates, causing a recession and dollar rally through to 1985. The Plaza accord then accentuated a weakening trend (which had already begun), before the Louvre accord helped to stabilise the dollar at lower levels. The 1990s (especially 2nd half) were dominated by the productivity surge and inflows into tech stocks (in the US – primarily). The noughties was then about ‘lower for longer’ on rates (less yield support) and a housing and consumer boom, which created the conditions for the latest secular bull market which has been ongoing since post GFC (i.e. a 14 year bull market). This latest phase has, like the 2H 1990s, been helped by significant equity inflows into the tech sector.
Fig 4: US dollar index shown with key bull and bear phases
Keep reading with a 7-day free trial
Subscribe to The (Long)View From London to keep reading this post and get 7 days of free access to the full post archives.