

Is This Time Different?
Is This Time Different?

Latest Longview Podcast (with guest ‘Jesse Felder’)
Last week I had the pleasure of speaking with Jesse Felder about ‘How to Make Money in Markets’. Jesse is the Author of The Felder Report. He also co-founded a multi-billion-dollar hedge fund in the late 90s, worked at Bear Stearns and runs the well-known finance podcast “Super Investors…and the Art of Worldly Wisdom”. He’s also widely followed in the world of Twitter (https://x.com/JesseFelder).
Our wide-ranging conversation on the podcast included sections on ‘value investing’, the ‘Insider BUY-SELL ratio’ and various other ‘fundamental’, ‘technical’ and ‘macro’ techniques for investing and picking stocks.
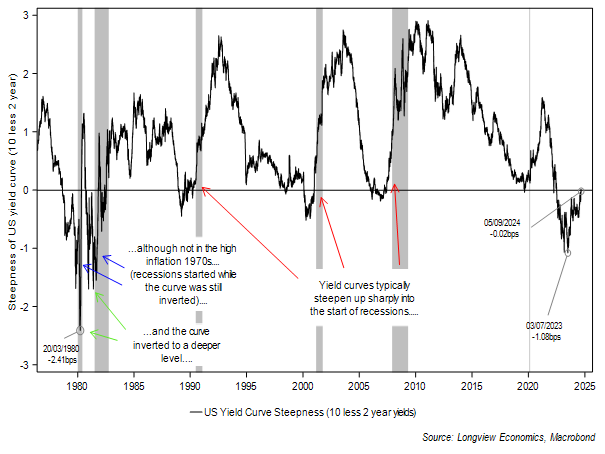
The Yield Curve is Dis-Inverting
“Many are familiar with the yield curve slope as the predictor of recessions: the track record is almost perfect, and there are good reasons why…..
…..A dis-inversion which happens after a long period of yield curve inversion is THE macro signal that has historically indicated weak growth ahead.”
Source: ‘Macro Alf’, LinkedIn post, 5th September 2024
The US ‘soft patch’ vs. ‘recession’ debate continues and, as we discussed in last week’s ‘(Long)View from London’ (“It’s All About the US Macro Call” - see HERE), it’s the critical debate in financial markets (at this juncture).
Indeed, most top level asset prices are poised at multi week, or even month, support/resistance levels (including 10 and 2 year Treasury yields, equity markets, gold, oil and many others). US rate futures, for example, are pricing in cuts of over 225 bps by the end of 2025. If the outcome is a recession, though, that will increase (maybe to 500bps). If it’s a soft landing, it could easily fall back to 100 – 150bps. Which way those key asset prices go from here will, almost certainly, depend on the market’s view of the expected outcome of that debate.
With the yield curve steepening (and trying to dis-invert), many are viewing that as an imminent signal of a recession. As ‘Macro Alf’ reminds his readers above, the dis-inversion is ‘THE macro signal’ of recession, not the inversion. Inversions signal tight monetary policy (hence why the steepness of the curve correlates with money supply growth – see FIG 10 in appendix). Dis-inversions almost always happen as the market anticipates the recession and, as such, prices in multiple rate cuts at the front end (hence the steepening).
FIG 1: US yield curve steepness (2s10s) shown with recession bands
The real questions, though, are:
i) How much should the yield curve be trusted? How useful is it on its own as a recession signal?
&
ii) Is this time different?
How Good is the Yield Curve Signal?
We addressed this question in various prior publications. In short, though, recessions tend to occur several months after yield curve inversions. The full list of signals and outcomes is shown in table 1 below.
Table 1: US yield curve inversions – behaviour in and around recessions
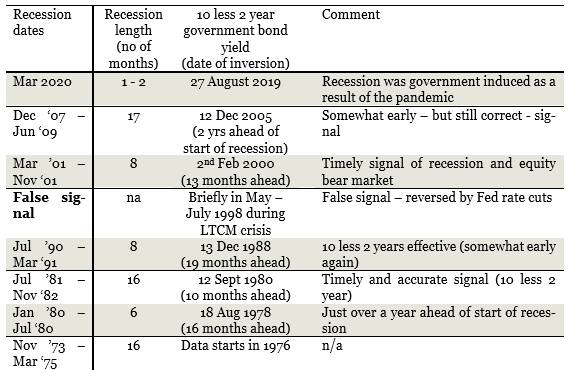
(Original) Source: Longview Economics, Longview Letter no 104, Sept 2016: “Forecasting US Recessions: ‘What Works – What Doesn’t’”.
However, it’s notable that since the 1970s (start of the data set), there have only been six recessions (i.e. not many data points). The last one happened because of the pandemic (as the government shut down the economy – i.e. it was voluntary/supply side and unique in that respect). In 3 of the other 5 prior examples, the curve inverted and then steepened before the recession (i.e. a perfect yield curve recession signal). Those were the 2007, 2001 & 1991 recessions.
In the other two examples (start of the 1980s/late 1970s), the economy was in recession before the curve became positively sloped (i.e. before it dis-inverted). In other words, in those two examples, the pattern of behaviour of the curve was different.
Added to that, there have been two false (or ambiguous) signals: Mid-1998, when the curve inverted briefly before re-steepening; and then just prior to the pandemic when there was a recession (but it was due to the pandemic/government shutdown not because of tight money).
Overall, therefore, whilst it’s theoretically correct that the curve inversion signals tight monetary policy, statistically the sample set is too small to draw any firm conclusions. That is, there are only five correct signals (and arguably only 3, if the late 70s are excluded as different), plus 2 that didn’t work.
What is clear, however, is that monetary policy has been tight. The signs have been very evident: Money supply has contracted; there was a banking crisis (March 2023); housing has been under pressure/struggled; and loan growth has been tepid/non-existent (the banks’ C&I loan book, for example, has had no growth in two years).
Is This Time Different?
But, is this time different? Is there an argument that the inversion and subsequent steepening of the curve won’t be shortly followed by a recession.
In markets, of course, that statement is regarded as wishful thinking. That is, people hope something will turn out differently, but it typically doesn’t.
However, the behaviour of other key recession forecasting indicators is different this time. That is, they are not generating a recession warning. They have an opposite signal from the yield curve.
Keep reading with a 7-day free trial
Subscribe to The (Long)View From London to keep reading this post and get 7 days of free access to the full post archives.