

US Wealth Growing Across All Income Groups
US Wealth Growing Across All Income Groups

US Lower Income Groups → Not As Stressed as the Bears Suggest
By Chris Watling, Global Economist & Chief Market Strategist
“The probability of a recession by Dec 2024 is at 63%. This level has ONLY been seen 3 times since 1960. All 3 ended in severe recessions → 1974, 1980 and 1981. This time is not different”
Source: Twitter, ‘Game of Trades’, https://x.com/GameofTrades_/status/1806340458810884335?s=09
The US recession debate rumbles on. Calls by various bears/economists continue (e.g. see quote above as well as comments from Nancy Lazar, Rosenberg and Albert Edwards, all highlighted in our US macro analysis).
This is, of course, a critical issue. Fourteen of the 15 recessions since the late 1920s drove cyclical equity bear markets in the US. Soft landings, meanwhile, are usually much less troublesome for the stock market (as monetary policy eases up to offset any economic weakness).
At the end of last year, we gave a 20% probability to a 2024 US recession scenario. That was an acknowledgement that some (a minority) of key recession indicators are generating warning signals (including the inversion of the yield curve; leading economic indicators – on some assessments; & the Conference Board ‘expectations less current conditions’ index). Added to which the labour market is softening.
Fig 1: US NIPA (national accounts) corporate profits (level, US$)
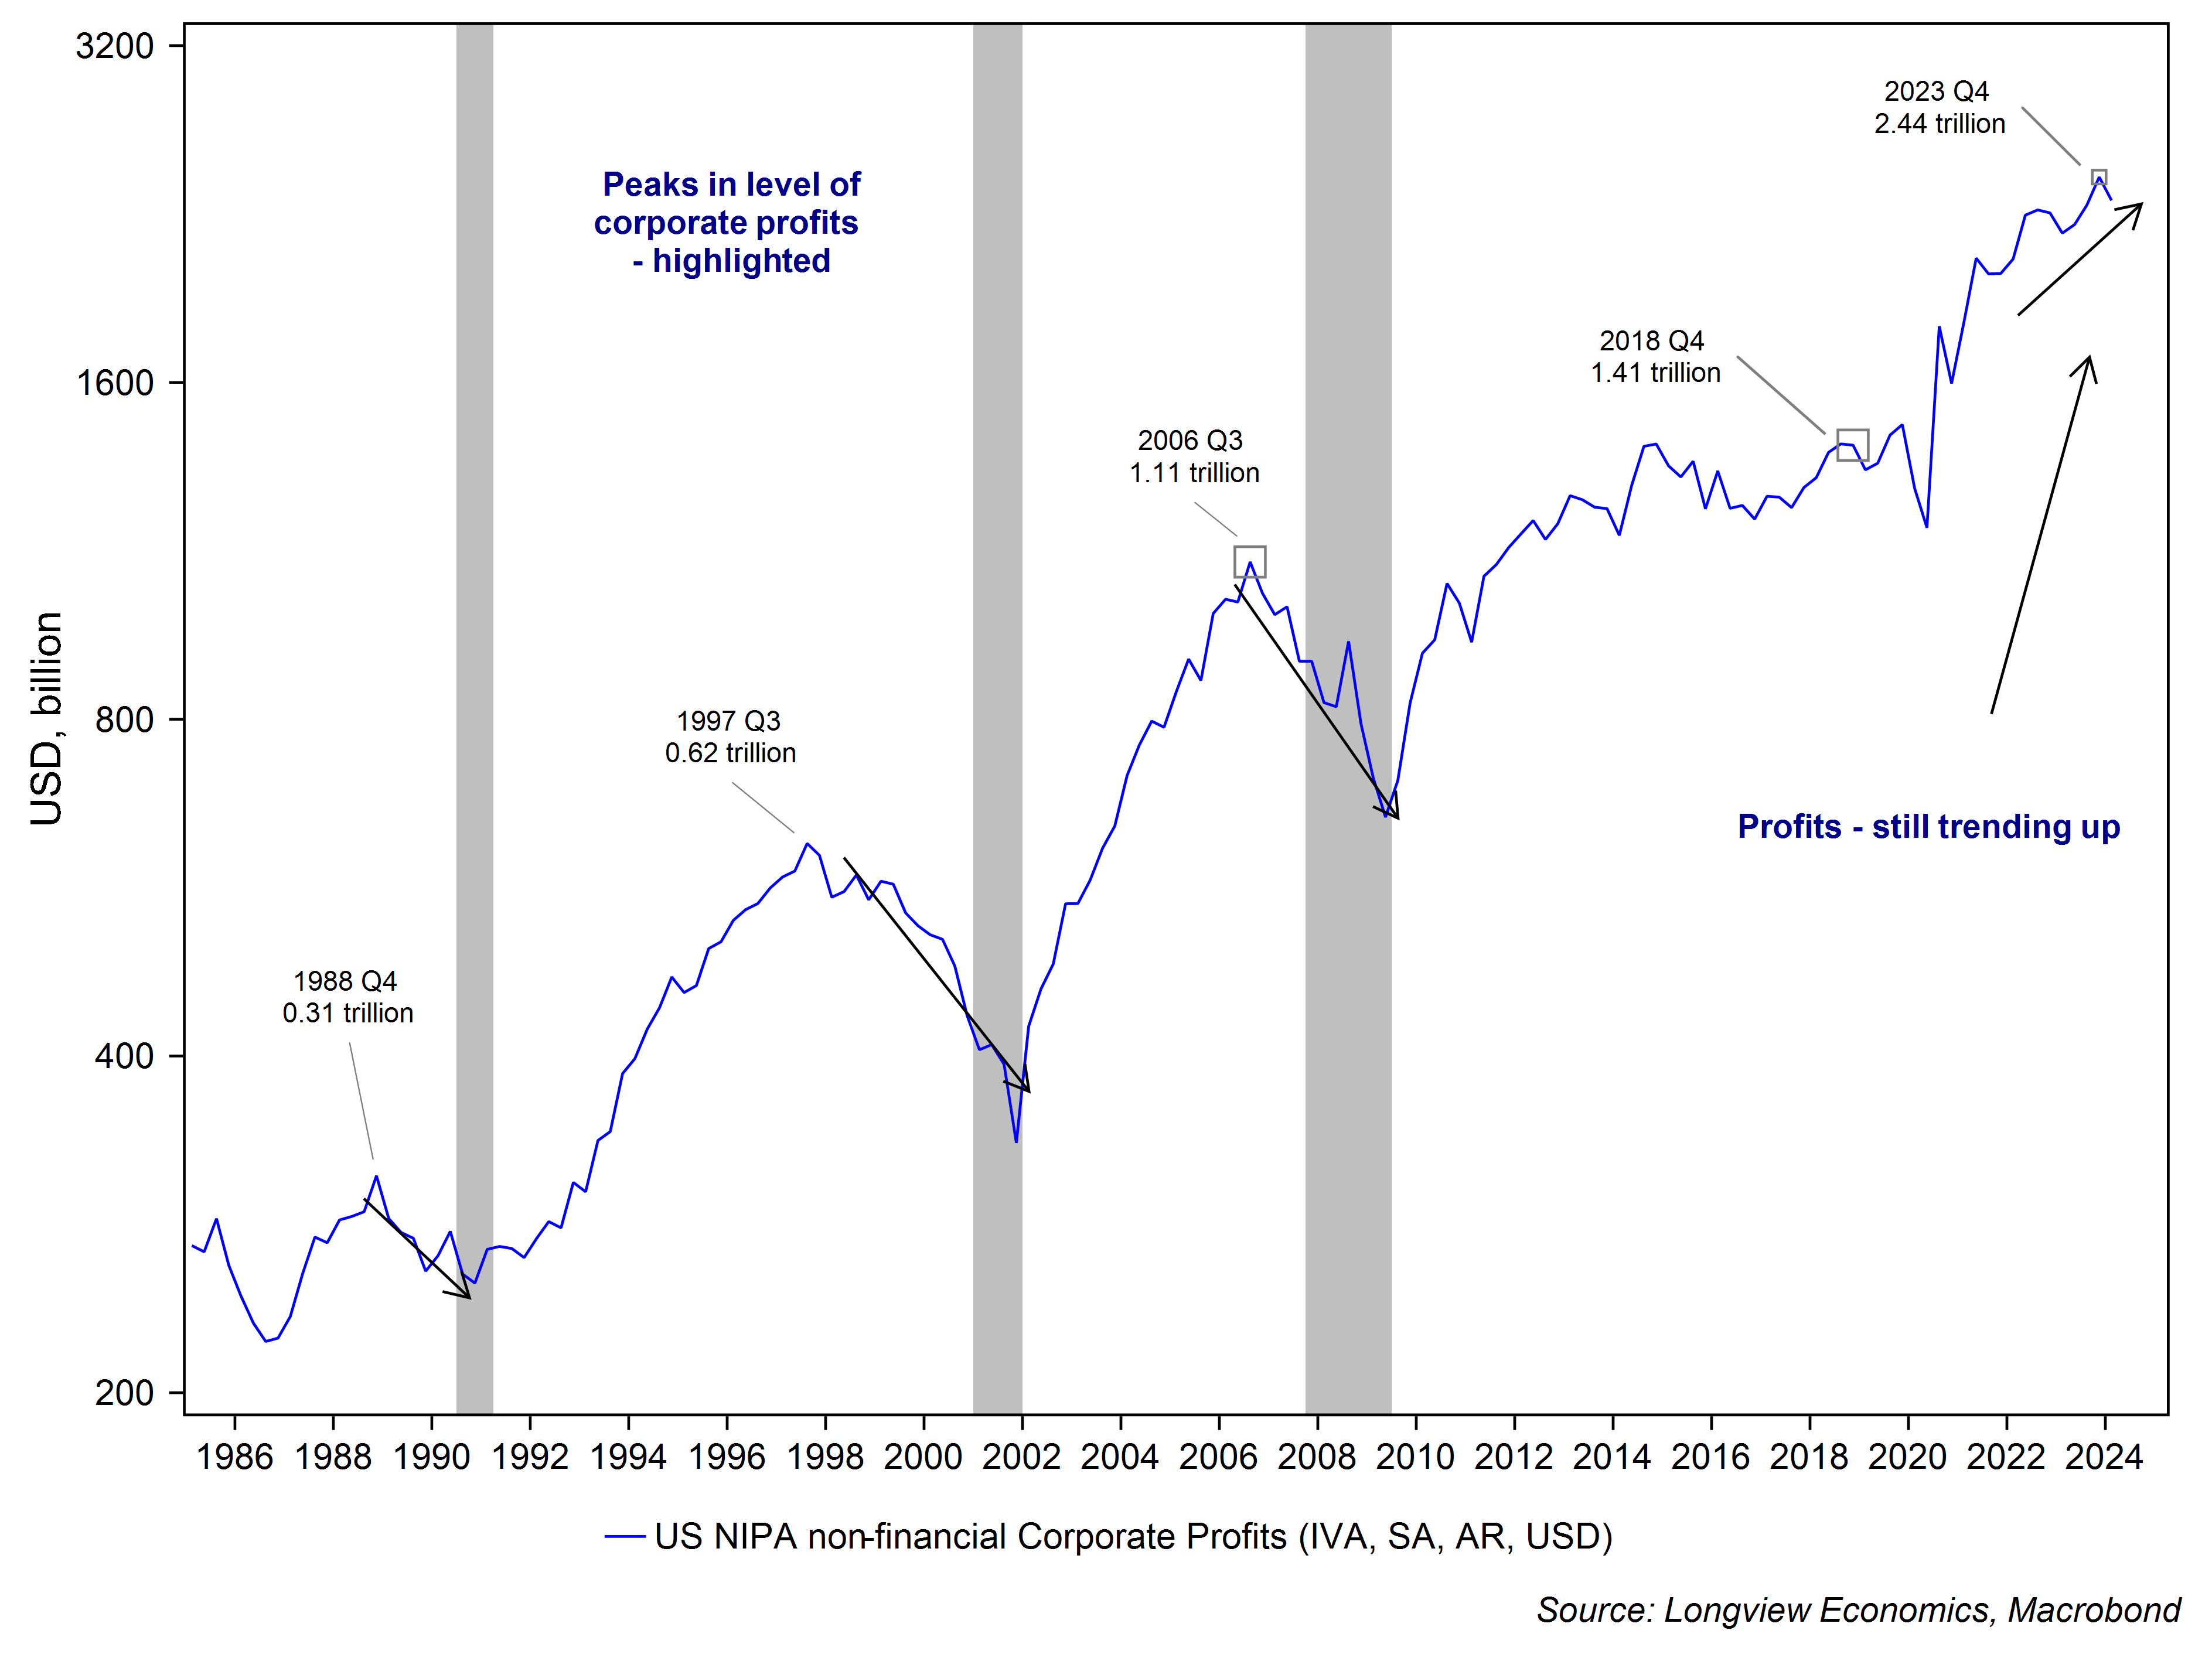
Equally, though, and as outlined in our two recent detailed assessments of the US economic outlook, the corporate sector is in good health (profits are growing, net debt is low and companies are throwing off high levels of free cashflow - fig 1), while credit conditions have been easing and financial conditions are loose.
Added to which, household net wealth is at high levels and its growth rate is accelerating. Annual growth was 8.7% Y-o-Y in Q1 2024 (with net wealth at 569% of GDP up from 551% a year ago1). As outlined in our 2016 Longview Letter (“Forecasting US Recession: What Works, What Doesn’t?”), when household net wealth is growing at 5% or less, recession risk rises. When its growth is above those levels, recessions are unlikely.
Interestingly, in that respect, the growth in household wealth is broad based and across all income groups. The net worth, for example, of the lowest 20% of income earners is rising at 7.8% Y-o-Y (latest data). For the 20th to 40th percentile group, it’s increasing at 5.6% Y-o-Y %, while for the 40th – 60th percentile growth it’s just under 5% per annum (fig 5 in appendix). Added to which, all those income groups have seen substantial gains in the past several years. The lowest income group’s net worth stagnated between 2007 and 2016 (at around $2 trillion). Since then, it’s risen steadily and is now over double its 2016 level (fig 2). Similarly the 40th – 60th percentile group also stagnated in wealth terms (from 2007 through to 2012). Since then, its net worth has gone from $5.5 trillion to over $12 trillion.
Fig 2: Net worth by income group ($ trillion)
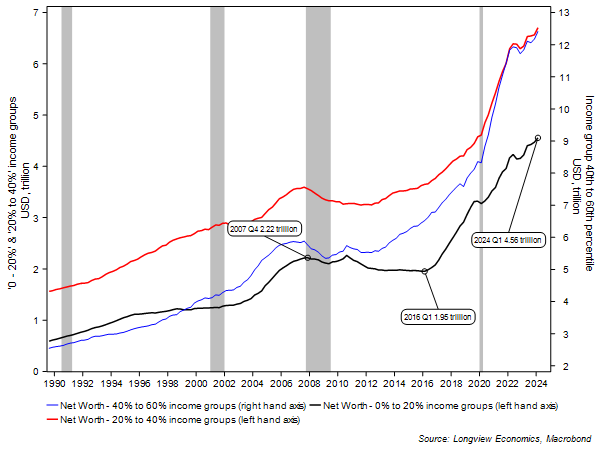
For all groups, therefore, whether their assets are skewed towards housing, equities or bank deposits, their net wealth is improving as asset prices trend higher and whilst there’s been little uptick in outstanding debt amounts (e.g. see fig 6 in appendix).
So while rising credit card and auto loan delinquency rates are arguably2 a concern (especially for lower income groups) and Michigan ‘buying conditions for big ticket items’ is falling again, the backdrop of rising net wealth is an important counter point to that. Added to which, according to the NY Fed triennial Consumer Survey, the number of people with ‘rainy day’ savings is again improving (after a falling in 1H2023) – fig 7 in appendix.
As such, with the overall corporate sector healthy and with all household income groups experiencing rising wealth, it seems unlikely that recent labour market softness is about to translate into an economy wide recession (i.e. the health of the private sector is good/has been improving). Unless, of course, the stock market is a bubble which is about to burst (and drive negative wealth effects and loss of confidence, thereby changing many of those key charts highlighted above)
Is Rotation Underway?
Keep reading with a 7-day free trial
Subscribe to The (Long)View From London to keep reading this post and get 7 days of free access to the full post archives.