


Bonds, Energy & What’s Contrarian?
Below is a round-up of Longview related views/research & trade ideas – this is published most Fridays, and updates key themes and highlights key pieces of (often contrarian) research.

What to Do with Bonds?
“In this line of thinking, bond yields are in their ‘blow off top’ phase with prices moving away from fundamentals and technically driven by capitulation by the LONGs (in this instance – as well as the over-leveraging of SHORT positions by momentum traders). This is the classic fifth or third wave in the ‘Elliot Wave’ technical approach to financial prices. Herd behaviour and capitulation drive a sudden/dramatic final move. In that framework, therefore, this is the final move in yields to the upside.”
Source: (Long)View from London, 6th October 2023: “Are the Bond Vigilantes Back?”
There’s currently much debate in markets around the outlook for bonds.
Indeed, in October, the evidence was mostly clear and facing one way. Bonds were oversold; sentiment had become bearish; there was panic about fiscal discipline in Congress (reflected in bond pricing); and, from a technical/price action perspective, yields had entered a ‘blow-off top’ phase, as we highlighted at the time, e.g. see quote above.
FIG 1: US 10 year Treasury yield (%), with 50, 90, & 200 day moving averages

With the sharp rally from October to December, though, those arguments have largely gone away and, anecdotally, there’s less conviction in markets on bonds (e.g. from client meetings).
Aside from reduced conviction, there’s also an ongoing debate about what (actually) drives 10 year bond yields.
One answer is from the ‘key actor’ school of thought. That is, bond yields are driven by supply and demand from key actors in the market. It’s undeniably intuitive, and supports the bearish case for bonds. That is, America’s large fiscal deficits will generate notably higher yields over coming months and years. Net issuance from the Treasury this year, for example, is expected to be $2 trillion and, according to the CBO, the US fiscal deficit will remain large (>5% of GDP) for the next 10 years (see HERE).
That answer, though, is probably the wrong one. A cursory glance at the chart below, for example, highlights the weak correlation between bond yields and government debt over the past six decades. If anything, the correlation is negative, with yields falling during phases of rising government indebtedness.
FIG 2: US 10 year bond yield (%) vs. US government debt (% of GDP)
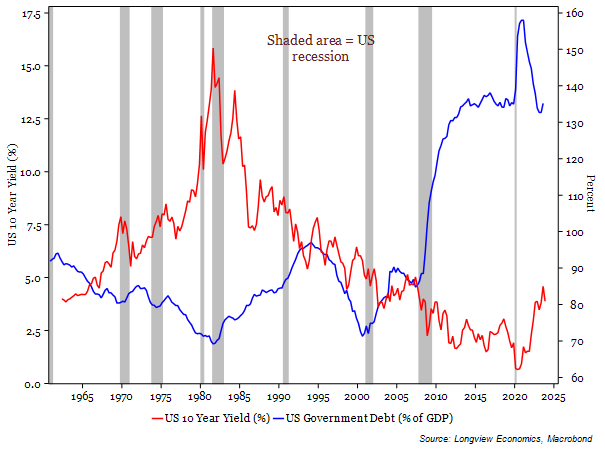
That chart is consistent with the work we’ve done on valuing bonds: Most of the time, bond yields are not driven by ‘key actors’; they are principally driven by changing expectations about growth and inflation. In other words, the Wicksellian approach to thinking about/valuing bonds is the correct one (as we’ve argued HERE and HERE , in prior ‘(Long)View from London’ publications).
This week, using that framework, we’ve been thinking about the long term drivers of US trend growth, inflation, and term premia. Taking that approach to valuing bonds, 10 year yields should be anchored at around 3.5% over the next decade in our view, and possibly beyond.
In the medium term (next 6 – 12 months), therefore, the question is: Will bond yields fall to that key ‘equilibrium’ level? And, if so, will they overshoot to the downside? Or, put another way: How many rate cuts need to be priced into the front end of the curve? And, what’s the outlook for term premium?
Current pricing points to 130bps of cuts in 2024 (with another 60bps of cuts next year). Is that enough? This time last week, the market had priced almost 160bps of cuts this year. Near term rates are, of course, key inputs for thinking about bonds (as well as the US dollar – see FIG 3).
FIG 3: US interest rate expectations (Jan ’24 vs. Dec ’24, bps) vs. USD index (DXY)

In our view, and as we lay out in this week’s note, the risk is that yields fall to and overshoot their 3.5% anchor. That should be driven by both lower real yields and lower breakeven inflation rates (please contact Nick Beazley nick@longvieweconomics.com for a copy of the full report).
Keep reading with a 7-day free trial
Subscribe to The (Long)View From London to keep reading this post and get 7 days of free access to the full post archives.