
Equities: The Worry List
Below is a round-up of Longview related views/research & trade ideas – this is published most Fridays, and updates key themes and highlights key pieces of (often contrarian) research.

Tactical & Strategic Portfolios
On both a tactical and strategic outlook we remain overweight risk assets.
Tactically we switched from underweight to overweight in October last year (and have remained overweight since that time). The tactical portfolio is designed to forecast US equity market direction on a 1 – 4 month time frame.
Strategically, in December last year, we moved from meaningfully underweight risk assets (primarily equities) to modestly positive. This portfolio is designed to forecast global markets on a 6 month to 2 year timeframe. These views will again be updated next week (when we publish the front section of the quarterly global asset allocation).
Over the course of the past two weeks, we have already published the first four sections of the quarterly global asset allocation process. Those sections include:
Eurozone macro update (Section 6): “Eurozone: Europe is Deleveraging!”, published 6th March;
US macro update (Section 7): “US Macro: Sectoral and Structural Health”, published 7th March;
China macro update (Section 8): “China: Economy Bouncing (but structurally impaired)”, published 12th March; &
Global Valuation update (Section 9): “How Much is the US in a Bubble?”, published 14th March;
Contact Nick Beazley at nick@longvieweconomics.com for a copy of the full reports.
At this stage, though, with an update of the front section coming next week, one of the key questions is: What are the Big Risks?
What Are The Big Risks?
Undoubtedly, the risks to the outlook are multiple (they always are).
Many of the current ones have been around for a while. They include: The risk of an oil price spike, perhaps in some way related to Ukraine or Gaza; election risks (not only in the US but elsewhere); the risks associated with inflation – is it, for example, sticky? And so on.
More importantly, though, there are three key, immediate risks which we are watching/focussed on.
There are as follows:
The looming liquidity risk. We’ve been analysing and writing about this risk extensively in recent months. With the ‘Bank Term Fuding Program’ now effectively shut off; and with the ‘RRP’ likely to run empty in the next couple of months, liquidity is expected to tighten up meaningfully (unless the Fed changes its policy stance quickly). If correct, then our liquidity model (which has correlated well with the S&P500 since the GFC and except for the past 18 months) will start to re-assert its correlation once again. This is why the Fed’s playbook on ending QT is important (along with the US Treasury issuance/and the Treasury department’s willingness to dip into its TGA reserves). The latest Fed hints on QT, though, don’t suggest that they are in a hurry to end it quickly. There wasn’t much discussion of ending it at the late January Fed meeting; both Governor Logan and Waller earlier this month endorsed an academic paper which suggested that the QE/QT effects are asymmetric (and QT doesn’t make much difference); while Powell, in January’s press conference, suggested that it wasn’t inconsistent to cut rates and still do QT. Signals from the Fed (as well as outcomes announced at the meeting next week) are, therefore, critical/bear watching closely. If the Fed is too slow to ‘taper QT’ – or is too late starting QE – the liquidity tightening will be magnified.
That looming liquidity risk feeds into the US valuation extreme. As Kindleberger outlines in his analysis, bubbles burst when ‘cheap money is removed’. The tightening of liquidity (in Q2/Q3) is, in effect, exactly that – i.e. the ‘removal of cheap money’. Given rich US market valuations, therefore, as discussed in this week’s ‘Quarterly Global Valuation’ update – (contact Nick Beazley at nick@longvieweconomics.com for a copy of the full report), then a second key pertinent risk is that the Fed loses control of the stock market in Q2/Q3 (as a bubble bursts). In that respect, the next year or so could become the next leg down in the bear market of 2022. That’s a risk.
The third key risk is the US labour market. In December last year we downgraded our 2024 US recession risk from over 50% to 35%. The rationale was somewhat mechanical with 7 out of our 10 key recession indicator categories in December 2023 signalling no recession. NB that total had been falling throughout 2023 with 8 out of 10 signalling recession a year earlier in January 2023. Furthermore with the Fed announcing a policy pivot, it was likely that credit conditions would also start to ease (which they since have).
The reason for keeping a significant (albeit less than 50%) probability, though, was a reflection of a few factors: i) The yield curve was (and still is) inverted (and has a good track record of predicting recessions); ii) the Conference Board’s leading economic indicators, as well as the ‘expectations less present situation’ index, were similarly both still signalling recession (and still are); while iii) the US labour market was fraying at the edges in December. Added to which the fiscal stimulus of 2023 is not set to be repeated in 2024 (i.e. deficit should be around the same size as last year).
Critically, while all those concerns remain in place, the labour market outlook has deteriorated further.
Deteriorating Labour Market Outlook
Weekly jobless claims and the establishment non-farm payrolls (NFP) data are two key labour market datasets which point to a robust US labour market. Last month according to the NFP data, the US economy added 275k net new jobs (after 229k in Jan). Weekly jobless claims, meanwhile, remain just above 200k with no sign of deterioration.
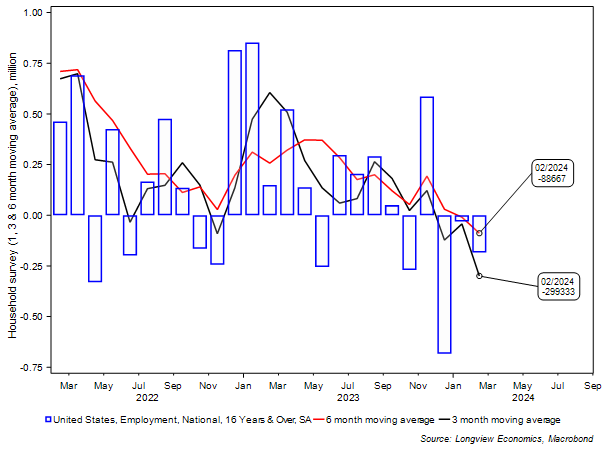
Elsewhere, though, there is a wide variety of labour market data/surveys which carry the opposite message. The job creation reported by the ‘Household survey’ (as opposed to the ‘Establishment survey’), for example, has been slowing since the first half of 2023. FIG 1 below shows the monthly household survey total with the 3 & 6 month moving averages. As the chart shows, on all three measures, job creation is negative.
FIG 1: US Household survey – monthly job growth (1, 3 & 6 m smoothed)
Within the establishment survey, the pattern of interaction between full time and part time employee job creation is generating a recession signal. Typically, the number of ‘full time employees’ rolls over/shrinks into a recession (as businesses employ part-time workers – to reduce risk). That pattern is currently occurring in the US. The number of full time employees (according to the Establishment survey) peaked in November last year and has since shrunk by almost 2 million workers. The number of part time employees has accelerated (as it often does heading into recessions – see FIG 8). The 6 month rate of contraction of full time jobs is now consistent with a recession (see FIG 9).
Keep reading with a 7-day free trial
Subscribe to The (Long)View From London to keep reading this post and get 7 days of free access to the full post archives.