Overweight & Nervous -> Complacency Abounds
Evidence the Bull Market is Tiring
“Deutsche Bank on Monday set 7,000 points as the target for the S&P 500 index by the end of 2025, saying it expects robust earnings growth to continue into the next year, among other factors.
Earlier in the day, Barclays raised its 2025 forecast for the index (SPX) to 6,600 from 6,500, on the back of a resilient U.S. economy, [a] gradual decrease in inflation and robust potential earnings growth of mega-cap technology companies.”
Source: Reuters
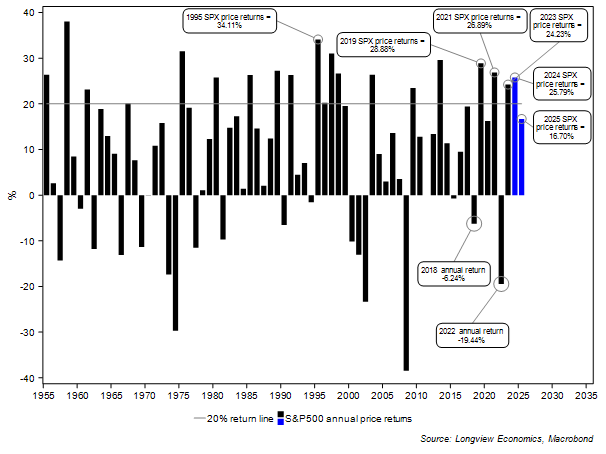
As always when the next calendar year looms, Wall Street Strategists are falling over themselves to be bullish. Earlier this week, Deutsche bank’s strategist set a target of 7,000 for the S&P500 by the end of 2025. If that happened, it would mark a strong 3rd consecutive year in a row of double digit gains (i.e. 2023 = 24.2% return; 2024 on track for 26% at current prices; with then another 17% on top to reach 7,000 from current levels).
Moreover, it will mean that 6 out of the 7 years (up to end 2025) would have delivered double digit S&P500 returns (with most of them over 20%). As FIG 1 shows, that clustering of multiple years of strong gains is very rare (going back 70 years on this chart). Perhaps not surprisingly, the only similar looking cluster of strong years of SPX gains occurs just prior to the TMT bubble peak.
FIG 1: S&P500 annual returns (%) – past 70 years
We are currently overweight in our recommended ‘Tactical Asset Allocation’ portfolio. This is designed to forecast the S&P500’s direction on a 1 – 4 month timeframe. In our strategic global asset allocation portfolios we are also (notably) overweight global equities – although underweight large cap US equities (within that overweight). This is designed for a 6 month to 2 year timeframe.
We are, though, very nervous about those weightings for four key reasons laid out below.
In particular, the S&P500 has now been in a bull run since late 2022 (i.e. over 2 years). Mini cycles typically last 2 – 3 years before there is then a major break (pullback) in the equity market. For example, the rally out of the GFC (March 2009 lows) only lasted until 2010/11 (Eurozone crisis) before a major pullback occurred; the rally out of the EZ crisis lasted until mid-2015 (when the Chinese currency crisis happened); then 2018 was challenging throughout the year; 2020 was the pandemic and so on.
For this market to rally to 7,000 by year end 2025, therefore, without a major pullback phase (which often lasts as long as 6 months) is unlikely, if history is any guide.
Furthermore, whilst in the near term (next few weeks/months) our key Tactical market timing models are not yet all on SELL (e.g. see SELL-off indicator – FIG 14 in the appendix), we are getting increasingly nervous about this uptrend in equity markets.
The reasons for that are as follows:
Keep reading with a 7-day free trial
Subscribe to The (Long)View From London to keep reading this post and get 7 days of free access to the full post archives.


