

UK Election – And US Liquidity, How Much Is There?
UK Election – And US Liquidity, How Much Is There?

UK Election Result
At a headline level, it was a landslide – not as bad as some feared with the Conservatives retaining over 100 seats (latest count 119 with 6 seats still to declare) but still one of the worst losses for the Tories on record (currently down 248 seats1). Labour has (on latest data) won 410 seats (+209).
Under the surface, though, and digging into the numbers this victory is more of a protest vote than a ringing endorsement for Labour. Across the UK, Labour got 33.8% of the national vote share on what has been a low turnout. For perspective, Boris Johnson won 43.6% in 2019 (last election) which was the highest single party vote share since Margaret Thatcher’s first election victory in 1979 (see table 1 below). Labour’s 33.8% share is only 1.7pp above their share when Corbyn lost heavily in 2019 (32.1% - table 1 below). Indeed, given the low turnout (60.0% vs. 67.6% in 2019), the number of votes for Labour is lower than the number that voted for Corbyn (9.6 million in this election2 vs. 10.3 million in 2019). In other words, more of the electorate voted for Corbyn’s labour than Starmer’s current version.
So, the question is how did that happen?
A combination of two factors: (i) the British ‘first past the post’ electoral system; and (ii) two protest votes.
The first protest vote is against the Conservatives. In England and Wales, the Conservatives lost 10 – 15% of votes in large numbers of seats to the Reform party (that allowed labour to win a lot of seats due to large swings away from the Tories). Reform is the latest version of the Brexit party. In 2019, Farage stood the Brexit party candidates down – hence Boris Johnson’s large vote share. In this election Reform took 14.3% of the national vote; the Conservatives took 23.7% (hence a combined vote share of 38.0%). The Lib Dems were also beneficiaries of disaffection with the Tories taking 12.2% of the national vote and gaining 63 seats (currently on 71).
The second protest vote was in Scotland, where the electorate is highly disillusioned with the SNP (Scottish National Party) given the scandals which have come to light in the past 1 – 2 years (and given 17 years of SNP rule in Scotland). The beneficiary of that has primarily been Labour who have seen their numbers of Scottish seats increase by 36 (to 37 seats). SNP have lost 38 seats.
Table 1: UK elections – national vote shares
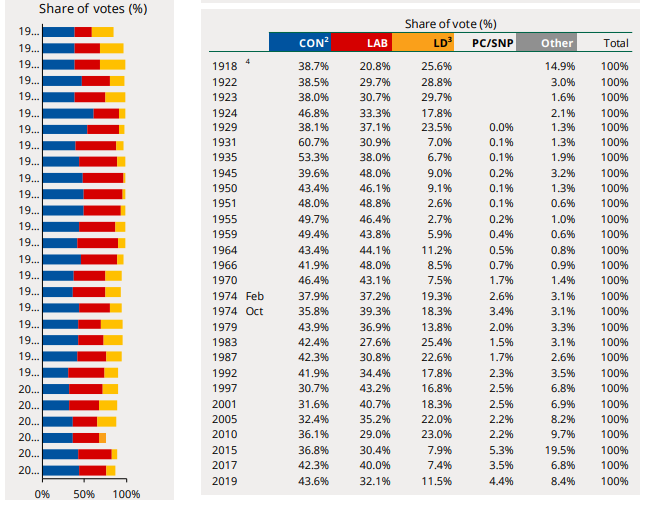
Source: House of Commons Library
Implications for UK markets/asset prices
We outlined Labour’s expected approach to fiscal and monetary policy HERE (recent (Long)View from London). This election result doesn’t change that. It also doesn’t change our expectation for a UK consumer and housing boom over the next 1 – 4 years3.
One of the more interesting questions to come out of this election is how the relationship between the Conservatives and the Reform party evolves over coming months. Many on the right of the Conservative party have been flirting with Reform (e.g. Suella Braverman, ex Home Secretary; Liz Truss, ex PM etc.), while the centrist Tories (known as ‘One Nation’ Conservatives) have been distancing themselves from Farage and Reform (e.g. Cameron’s recent comments). How this gets resolved will have a major impact on whether Labour get one or two terms. If the two parties can find a way forward together, Starmer’s time in government could well be limited to one term, given the lack of voter enthusiasm for his offering to the electorate.
So, what appears to be a landslide is as much a product of the first past the post system and a protest vote against the Conservatives, as it is renewed British affection for this current labour project.
Podcast on Globalisation & the ‘Crisis of Democracy’
This week we released our ninth ‘Longview Conversations with…’ podcast.
In this episode we sat down with Mike O’Sullivan to discuss the ‘end of globalisation’; the ‘crisis of democracy’; and the ‘interregnum’ years between the last phase of globalisation and the next one.
In other words: How is this volatile world likely to resolve itself? And, what will this year’s elections mean for the global economy and global financial markets? Click on the LINK in the image below to access:
-Jul-03-2024-12-37-44-4958-PM")
US Equities – More Upside Left?
By Harry Colvin, CFA, Director & Senior Market Strategist
Once again, tech stocks seem bullet proof, and have been the driving force behind US equities this past week, pushing both the S&P500 and NASDAQ100 out to new all-time highs.
Illustrating that, the chart below splits the sectors of the S&P500 into its three key components (long duration growth, cyclicals, and defensives4). This week, long duration growth (i.e. IT) continued to retrace its losses from mid-June, made a new record high, and is now up 32% YTD (as of Wednesday’s close). Naturally, that’s mostly been driven by Nvidia (+9% since last Monday), and more recently Tesla (+36% in 2 weeks). Other key semiconductor stocks, though, have also performed well in that time, e.g. with strong gains in Micron (+7%) and Broadcom (+10%). Cyclicals and defensives, in contrast, are only up ~12% YTD (and broadly flat in recent weeks, FIG 1).
FIG 1: S&P500 (split into defensives, cyclicals, and long duration growth4), % YTD

The key question, therefore, is how much more upside is left? Will tech and key AI themes keep leading the market higher? Or is this trade close to exhaustion?
This week we published our tactical equity asset allocation update, in which we laid out the rationale for staying OW US equities (for now).
In particular, phases of strong, risk seeking behaviour in markets end when: (i) positioning becomes crowded; (ii) there are broad based signs of complacency; added to which (iii) price action usually becomes euphoric (with a rapid somewhat vertical ascent in asset prices – i.e. a blow-off top).
Keep reading with a 7-day free trial
Subscribe to The (Long)View From London to keep reading this post and get 7 days of free access to the full post archives.