


Buffett and the ‘Stock Market Equation'
Warren Buffett, Aesop's Fable & What it Means for Today's Stock Market

Warren Buffett, Aesop, the Bird and the Bush
“A bird in the hand is worth two in the bush”
Source: Aesop, 600 BC
“each stock should be considered on its own merits, using future forward expected cashflows, discounted by an interest rate and measured against a cash return (i.e. the current interest rate). Some account/reward also needs to be included for holding an uncertain stream of cashflows instead of a more certain cash return (i.e. the risk premium). Overall, therefore, he highlights a remarkably straightforward approach.”
Source: Longview on Friday, 31st January 2020
Warren Buffett famously quoted Aesop at his 2000 annual investor meeting. Aesop (of Aesop’s fables), speaking in the year 600 BC, made the observation in the quote above.
Buffett, with his ability to simplify complex issues, used this ‘fable’ to explain investing (video clip below). In the above quote we summarised his investment approach (as articulated in that video).
The Stock Market Equation
Expanding that concept to the stock market, then the S&P500 is worth next year’s expected earnings, multiplied up by an amount that investors are prepared to pay for the whole multi-year future earnings stream (i.e. the PE ratio) – see equation one below. If the long term earnings growth outlook is very high, theoretically investors will pay a high multiple for the earnings stream (i.e. high PE ratio). Equally if the current risk free rate is high, then the multiple that they are likely to want to pay is lower (as the earnings yield – the inverse of the PE ratio) needs to be higher to ensure sufficient compensation relative to the risk free interest rate – see equation two below.
Stock market equation one:
S&P500 index level (or indeed any market) = PE ratio * Future EPS
Stock market equation two:
S&P500’s earnings yield (EY – i.e. inverse of PER) = Equity risk premium (ERP) PLUS real bond yield (RBY)
Taking those one step further: Over the very long term (i.e. Buffett and Berkshire’s typical investing horizon), then the PE ratio (& therefore EY) and the real bond yield should theoretically rotate around a mean (i.e. mean revert over time). As such, over very long timeframes, the stock market is all about earnings growth.
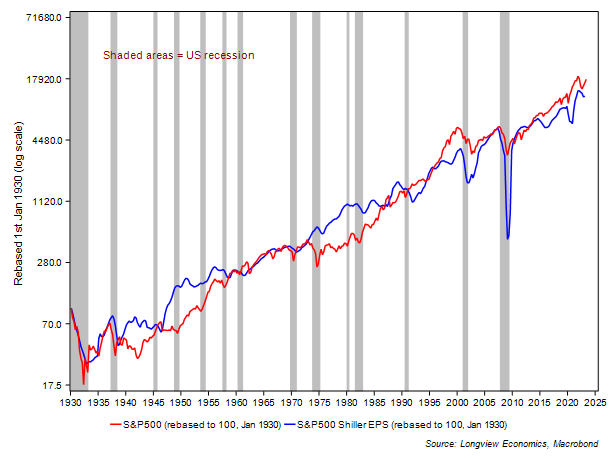
This can be observed in the chart below which plots the S&P500 and Shiller EPS (both rebased to 100 in 1930 and shown with a log scale – FIG 1). As is clear from the chart, the two lines basically follow each other, although they do move apart for prolonged periods of time (i.e. as PERs expand/contract). Eventually, though, they always reconnect.
In a similar vein, over time the PE ratio should (theoretically) revert to its long term mean – albeit, in the example of the SHILLER PER chart below (FIG 2) the mean appears to have shifted higher in the past 25 years.

So, What Does that Mean for Today’s Stock Market?
First, it seems increasingly difficult to deny that the S&P500 has been in a bull market for the past 9 months (albeit this isn’t the case for many other countries’ stock markets, like in Europe, Australia, Emerging Asia, China etc., which have tracked sideways since earlier this year, mostly from February).
In particular, since its October lows, the S&P500 has rallied significantly (above the so called ‘20% rule’ – FWIW1), key Fibonacci retracement resistance levels have been taken out (including the 61.8% retracement level), while the earnings expectations have turned up (FIG 10 in appendix). Added to that, the rally has broadened (especially in June), and the consumption and the labour market data, in particular, have remained robust. The Grantham ‘bubble bursting’ thesis, therefore, has either been pushed back or is incorrect.
Supporting that US rally in the past six months, stock market sentiment has switched (from maximum bearish to bullish) and industrial production has expanded (for the past 5 months, i.e. since December – FIG 12), perhaps brought about by the sudden reopening of China (and reinforced by $400 billion of extra liquidity during the March banking panic). With that, our ‘bull-bear’ models for the stock market (which we use as a sanity check) have started to signal a new cyclical bull market – e.g. see FIG 3.

Where to Next?
The question now is: Where to next? Has the latest bull run now played out? Or are the market technicians, who point to analysis which suggests that the market will make more gains in 2H 2023, correct?
Keep reading with a 7-day free trial
Subscribe to The (Long)View From London to keep reading this post and get 7 days of free access to the full post archives.